

Introduction
 The transformation of the poultry industry in recent years has witnessed a significant shift in consumer preferences, ostensibly due to massive urbanization, and development of preference towards fast-food amongst the young generation. The advent of online platforms and expansion of eateries with well-established brands like KFC and McDonald’s as well as a multitude of unbranded local establishments are the other major contributor in shaping the product preferences of the consumers. This paradigm shift in the consumer behavior has resulted in a complex and competitive environment, leading to a departure from the conventional decision-making methods. So, a poultry producer who used to decide on the future course of the business based primarily on past production records, local market trends and established farming practices, now must take resort to an advanced data analytic technique to reach a more logical and pragmatic decision.
STATISTICS emerges as the HERO in the new era by offering a treasure trove of tools and methodologies essential to navigate through the intricate datasets inherent to any industry and poultry industry is not an exception. By tapping into statistical techniques, stakeholders can unravel meaningful patterns, identify key trends and make informed decisions that transcend intuition or historical practices. However, overlooking the advanced statistical methods can lead to financial losses that may affect the bottom line. Without meticulous analysis, the potential for misinterpretation increases not only for a meat and egg producing operation but also for the breed manufacturers. For the latter, an Ineffective breeding program lacking in precise statistical insights inevitably leads to a compromised genetic quality of the progeny. The good sign is the new generation entrepreneurs have started believing that data is not just a by-product but a powerful ally for decision-making.
Unleashing business brilliance with advanced statistical tools in poultry industry
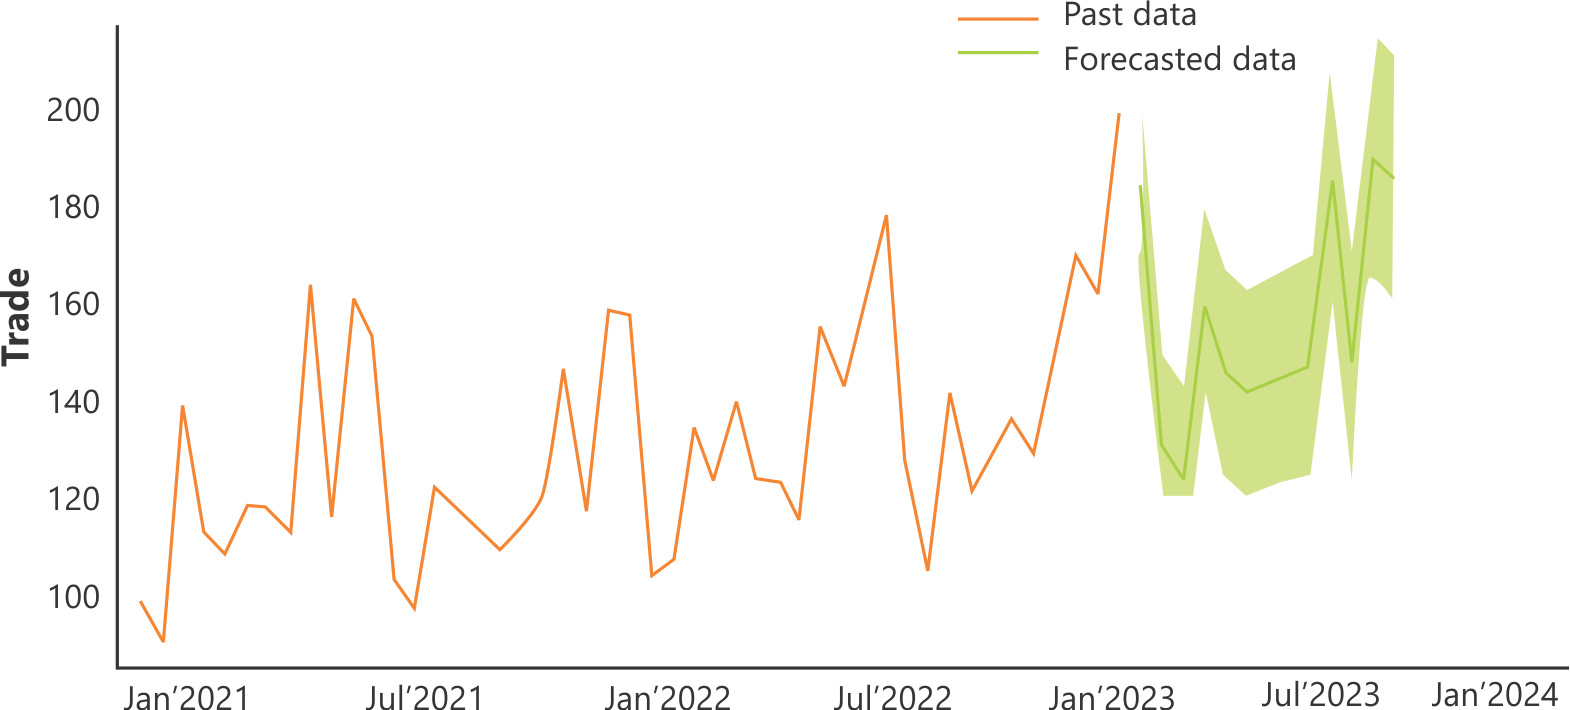
The new tool which can bring about a paradigm shift in the process of decision making involves machine learning which is a branch of artificial intelligence and computer science that focuses on the using data and algorithms to improve the accuracy of data processing. Machine learning like a conductor creating a magical symphony, understanding the patterns, forecasting the trends, and making predictions for businesses. Like the other  industries, the poultry industry too can leverage through the predictive analysis done by machine learning to optimise product pricing, effective production planning, and tailor product development to meet the evolving needs from a global perspective. One of such tools is regression analysis which provides valuable insights about the future demand scenario by analysing the trend of the business at present. The tool is so powerful that it provides enough information to the producer to completely shift the business orientation. Probably the best example is the gradual shift being made by the broiler integrators to move, albeit gradually from the wet market strategy to the processed meat or ready to cook meat production or for a layer farmer to shift to come up with packaged eggs or even egg powder instead of selling the same in wholesale markets.
Classification analysis is another tool that can identify the potential customers. This tool helps a business operation to categorize the customers and deploy their sales force strategically. This predictive approach not only saves significant resources in terms of time and money but also ensures a targeted and personalized approach to engage with potential clients.
Clustering technique can be employed by, for example a feed manufacturer to analyse factors such as ingredient preferences, market trends, and production costs to categorize the patterns and trends which helps in identification of distinct groups in the market. The  manufacturer gets insights about the segments of its customer base and what appeals these segments the most. The data thus generated helps to tailor the products, be it a feed or an additive or medicine or vaccine to meet the specific needs and preferences of most of the segments. This strategic use of clustering not only enhances product customization but also empowers the manufacturer to adapt to diverse demands efficiently, ultimately fostering customer satisfaction and bolstering their competitive edge in the industry.
The Time Series tool reveals the future trend by analysing the historical data thus offering strategic advantages to the business. Seasonality captures recurring patterns tied to specific time periods, such as seasonal demand for certain products. Cyclic patterns highlight repetitive trends not bound by fixed timeframes, offering businesses a deeper understanding of extended economic cycles. Time Series proves to be an indispensable tool in strategic planning and proactive decision-making.
Cracking the Code: Fundamental Statistical Tools in Poultry Research Analysis
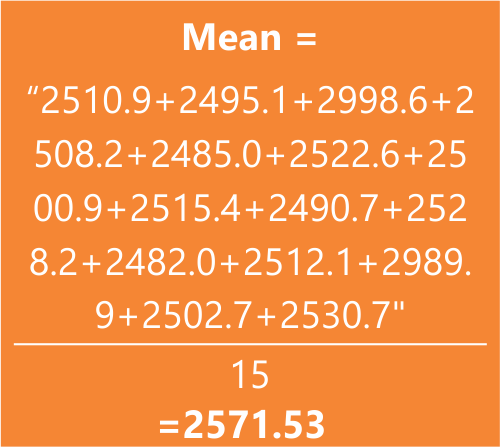
Data analysis in poultry research can be a game-changer. However, for this understanding the measures of central tendency is a must. Central tendency helps to understand where the data tends to cluster. They are the crucial tools for understanding the “typical” or central value in a dataset. The three primary measures of central tendency are mean, median and mode, each offering unique insights into the characteristics of the data. The mean is the arithmetic averagewhile the median is the middle value, and the mode is the value that appears most frequently in the dataset. Consider a dataset representing the weights of a flock of chickens. The mean weight would provide the average weight of all chickens, giving a general sense of the flock’s overall size. However, reaching a sanguine conclusion about the flock’s performance based just on the mean value may not be correct always especially if the data possess some outliers i.e. a few of which may lie in the extreme ranges.
 Suppose the Body Weight of 15 birds at 42nd day is {2510.9, 2495.1, 2998.6, 2508.2, 2485.0, 2522.6, 2500.9, 2515.4, 2490.7, 2528.2, 2482.0, 2512.1, 2989.9, 2502.7, 2530.7}
 Median =
((n+1)/2)th value of the ordered observations [“2482.0, 2485.0” , “2490.7, 2495.1” , 2500.9, 2502.7, “2508.2” , 2510.9, 2512.1, 2515.4, 2522.6, 2528.2, 2530.7, 2989.9, 2998.6 ] = 2510.9
Where, n = number of observations
Note that, Here, n is odd, for even, median is calculated by taking the average of (n/2)th and (n/2 +1)thvalues.
Concept of Outliers
An outlier is an observation in a dataset that deviates significantly from the overall pattern, potentially indicating errors, anomalies or unique occurrences.
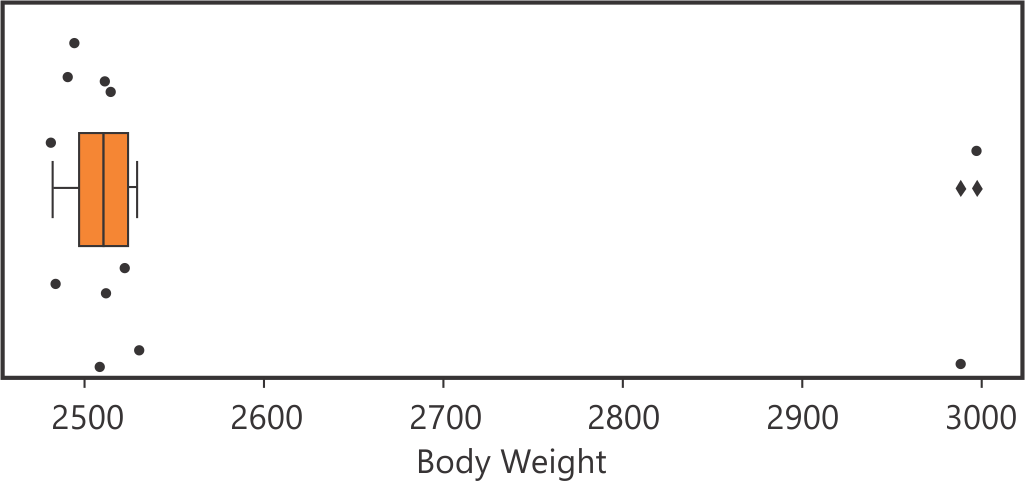 After removing the outliers, the mean becomes 2506.5.In the presence of outliers, the mean indicates an additional weight of 65 grams, whereas the median remains nearly equivalent. Probably, in this situation the median becomes more important. In fact, while judging the performance of a flock it is important to assess the nature of the data first followed by a comprehensive understanding and identification of the outliers and assessing the likely impact of the outliers.
Now, let us take an example where mode plays a significant role. In a dataset of small intestinal lesion scores obtained from 15 chickens at 24-day of age is something like 3,1,1,1,1,2,1,1,4,1,1,1,1,1,3 which yields a mean value of 1.53 with 1 showing the maximum frequency or mode. If the mean value is presented as the central value, then it should be a misinterpretation because nearly 73% of the scores within the group is 1. So, in this case mode, and not the mean value is the measure of central tendency.
The Advantage of Smart Experiments: Design of Experiments
Structured experiments allow the poultry scientists to study and understand different aspects of a poultry operation spanning from picking up the correct feed formulation and supplementation strategy under a given condition or the right vaccination frequency under a prevailing disease load to the optimum house temperature in a particular season. This is possible only through structured experiments. Combining the data of a series of structured experiments on a specific topic yields the general tendency of a new approach. Consider the following experimental design the effect of the two enzymes at two different levels of dietary energy to be ascertained:
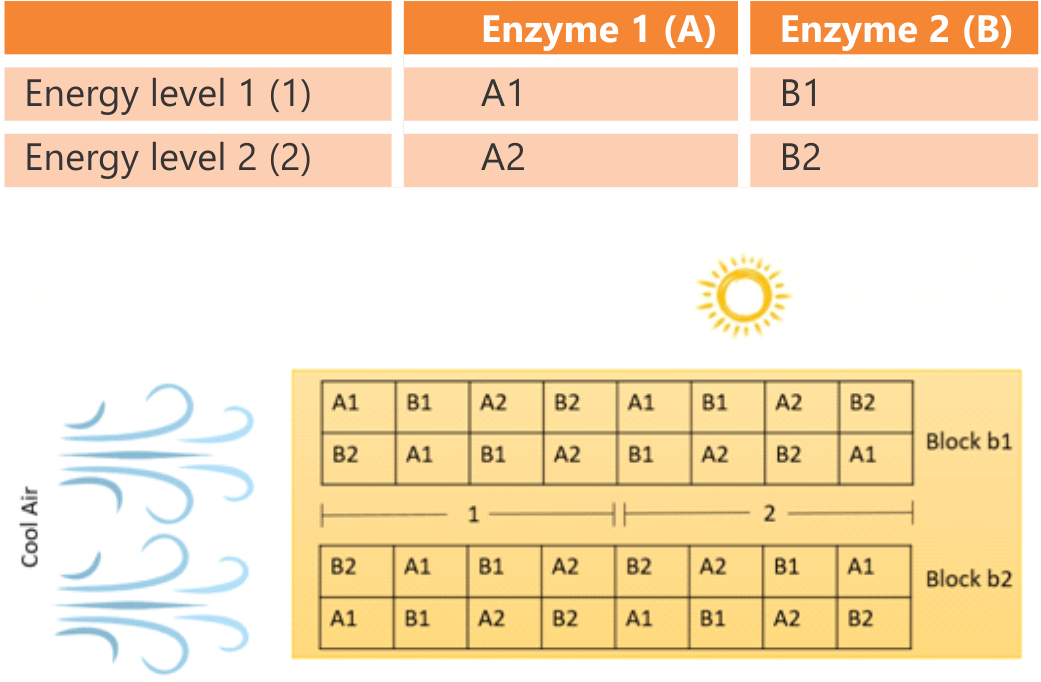 The experimental farm is an open sided one and a portion of it is exposed to intense sunlight during a particular time of the day while through the other side a consistent cold wind blows from a specific direction. These environmental factors introduce variations in the data, leading to misinterpretations. Hence, it becomes imperative to mitigate these sources of variations through a well-thought-out experimental design that nullify the variations and extracts the genuine effects of treatments. To minimize the environmental effects the experimental house is strategically divided into four distinct blocks,B11, B12, B21, B22, on the basis of the external source of variation (errors). Each block encompasses an equal distribution of every treatment, covering all possible combinations. This meticulous design facilitates more accurate analysis leading to a more robust interpretation.
Power Analysis
Power analysis is a statistical technique used to determine the probability that a study will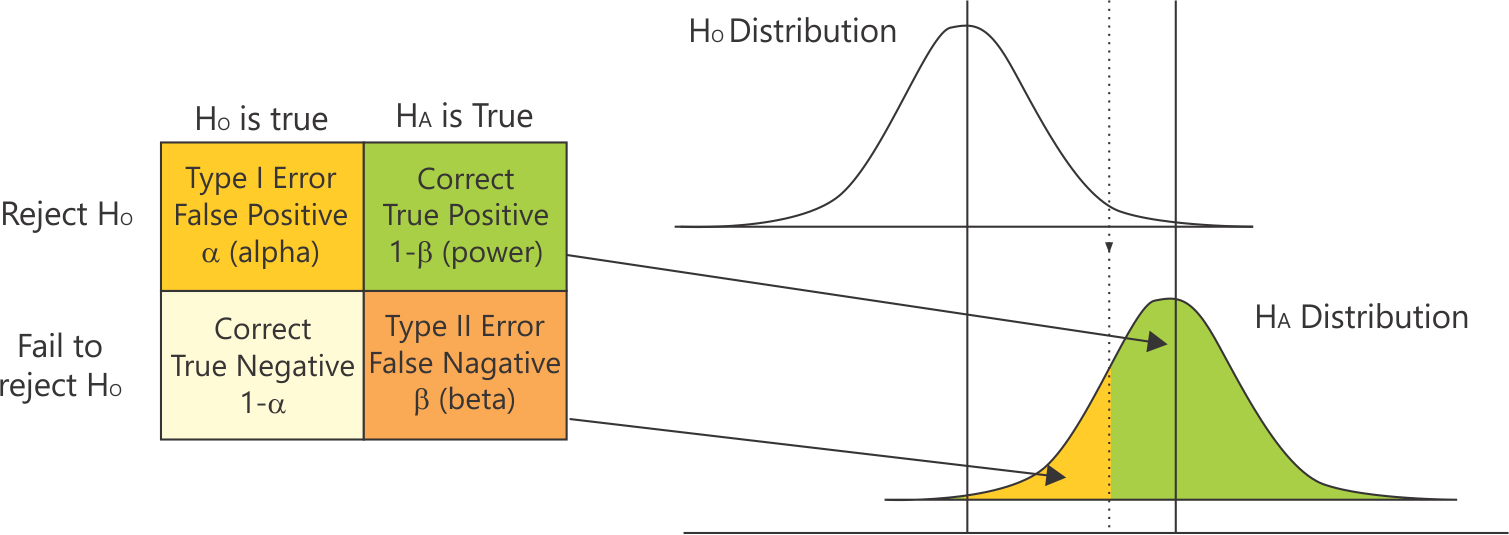 detect an effect or difference when it truly exists. In other words, it helps researchers assess the sensitivity of their experimental design to detect a meaningful effect. An experiment should start with a hypothesis. For example, if the experiment aims to determine the effects of the treatments on body weight of the birds, then it may be assumed that all the treatments may have similar effects or may not. The former is the null hypothesis (Ho) and the latter is the alternative hypothesis (HA).
In the above picture (right), the greater the green part, the better is going to be the outcome and the interpretation will be more accurate. This is called the power of analysis which helps the data scientist to determine the perfect number of replication. Without a good number of replication, it becomes really difficult to comment on the treatment effects – whether they are true treatment effects or are due to some artefacts.
Analysis of variance
Controlled experiments are conducted to get an idea about how different treatments (or the factors, the effects of which are going to be determined) applied on the birds behave. Based on the preliminary data large scale trials are designed. A correct interpretation of the data generated from the initial experiments is of utmost importance since this is going to be the base on which the future trials are to be designed. Analysis of variance (ANOVA), is the tool that instead of just looking at the averages, digs deep into the data to ensure that the observed variations are meaningful and not just random. ANOVA ensures that if one treatment stands out, it’s not just by chance. It is genuinely better.
There are situations where scientists use ANOVA to compare a “Normal Condition (Negative Control)” with a “Challenge Condition (Positive Control)” where extra hurdles are put and treatments are applied on the challenged condition to ascertain how and if at all the treatment can overcome the “hurdle”.
ANOVA yields Fstatistics values with corresponding P values. If the P value is small (<0.05 usually), it signifies that the treatment makes a real difference at least in 95% cases if the same treatment conditions are repeated 100 times. If it’s big (1 > P > 0.05), the treatments are more similar than expected. Thus, P values guide scientists in making decisions about the likely outcome of a treatment applied on the chickens.
There may be situations where more than one treatments are applied against a single negative control and/or positive control. A significant P value would indicate that the treatments worked. However, this does not indicate about which treatment worked better or whether all the treatments worked alike. So, a further tool, called the Post Hoc Test, is applied to identify the real winners.
Analysis of covariance
Analysis of covariance (ANCOVA) is like a turbo boost for ANOVA. It’s the secret that brings in covariates, the factors that might have influence the final outcome of the results. For example, if the experiment aims at determining the effect of different diets on growth rate of chickens then ANCOVA does not just look at the average weight gain by the birds in different dietary groups, but it also considers feed intake by the birds because feed intake here is going to have a profound effect on the body weight of the birds and this influence cannot be gauged unless feed intake is used as a covariate. So, ANCOVA is the upgraded version of ANOVA which does not just stop at comparing the averages but goes further deeper to associate the other factors which might influence the average.
Addressing Common Challenges in Poultry Data Analysis: The Pursuit of Precision
Several common challenges can make the application of statistics a bit of a puzzle. Dealing with very small datasets, capturing data casually, and occasional errors due to a lack of data knowledge are the hurdles often encountered. Casually capturing data is akin to sketching rather than taking a detailed photograph. This approach may miss crucial details, leading to an incomplete representation of a poultry operation. Avoiding a casual attitude toward data is crucial for obtaining accurate insights and making informed decisions. In the world of poultry analytics, the abundance of data is like having a rich source of information which can accurately portray. It ensures a more accurate portrayal of the poultry environment, allowing for a nuanced and reliable interpretation. Having a substantial dataset is the bedrock for building robust insights that withstand the complexities of statistical analysis.
Conclusion
Promoting a data-driven mind-set should not just be a strategy but a transformative culture that would propel the industry forward. Embracing the power of data science in the short term and long-term operative goals should culminate into continuous improvement, informed decision-making, and adaptability which hitherto is somewhat lacking in the poultry industry in this subcontinent. By recognizing the value of comprehensive datasets, acknowledging the challenges, and investing in data literacy, the industry can unlock new avenues of efficiency, innovation, and sustainable growth. A data-driven mind-set is not merely a tool, it is the compass guiding the industry towards a future where insights gleaned from data become the cornerstone of success and resilience in a rapidly evolving landscape.
by Sudipto Haldar, Agrivet Research & Advisory


